Retail Operations · Data Analytics

Nguyen Ngoc Phuong Trinh

Retail Operations Manager — MUJI Vietnam

Six years running retail floors, from supervisor assistant to store manager. I lead the daily operation of a store where footfall is low and every decision on stock, staffing and display has to earn its place. Today I read those same stores through data.

Supply chain analysis dashboard built in Power BI

Supply Chain Performance Dashboard — see the full report ↓

6
Years in retail operations
4
Roles, assistant to manager
1
Store led end to end
Power BI
Certified, 2026
About

Six years on the shop floor, now reading the floor through data

Nguyen Ngoc Phuong Trinh
Retail Operations Manager
MUJI Vietnam

I manage retail operations at MUJI Vietnam, where I have spent six years moving from supervisor assistant to store manager. My work is the unglamorous half of retail: stock that arrives late, shifts that run short, a display that quietly stops selling. Those are the things behind every number on a sales report.

I currently run MUJI Le Van Viet in District 9, Ho Chi Minh City — a store with modest footfall. That constraint shaped how I work: without volume to absorb mistakes, merchandising, staffing and inventory decisions have to be made on evidence rather than instinct.

That is what pushed me into analytics. I wanted to answer why rather than stop at how much, and to answer it with evidence solid enough that someone else is willing to act on it. The supply chain project below is the first piece I took end to end that way.

I am now studying three programmes on AI for data analytics — AI agents, Excel and Google Sheets. The goal is to make this kind of analysis run on its own, instead of being rebuilt by hand every month. See what is in progress →
Skills & tools

Retail operations

  • Store Operations
  • Sales Planning
  • Inventory & Stock Control
  • Workforce Scheduling
  • Visual Merchandising
  • Team Leadership

Analytics & reporting

  • Power BI Desktop
  • DAX
  • Power Query
  • Data Modeling
  • Star Schema
  • Time Intelligence
  • Excel

Analytical thinking

  • Business Framing
  • MECE Decomposition
  • Pareto Analysis
  • Diagnostic Analysis
  • Data Storytelling

Experience

  1. 2026 — Present
    Store Manager
    MUJI Le Van Viet — District 9, Ho Chi Minh City

    Full ownership of a low-footfall store: commercial results, inventory, staffing and floor operations. Performance here comes from the quality of each decision rather than from traffic volume.

  2. 2023 — 2025
    Senior Supervisor
    MUJI Vietnam — Flagship Store

    Coordinated daily operations at the flagship store, the largest in the network by both assortment and footfall.

  3. 2020 — 2022
    Supervisor Assistant → Supervisor
    MUJI Vietnam

    Started on the sales floor and moved through merchandising, stock control and shift coordination.

Education & certification

  1. Expected Oct 2026 In progress
    AI for data analytics — three programmes
    AI Agent for Data Analytics & Decision Making · AI-Powered Excel for Data Analytics · AI-Powered Google Sheet for Data Analytics

    Each programme ends with its own capstone and certificate in mid-October 2026.

  2. Aug 2026
    Master Analytical Thinking & Data Analysis with Power BI
    The Future Analyst Academy · ID MAD14Q7E3

    Completed with the Supply Chain Performance Dashboard capstone.

Selected project

Supply Chain Performance Dashboard

A Power BI report on retail supply chain performance — delivery time, return rate, shipping mode and regional logistics — connecting operational numbers to the profit they end up producing.

Seven linked report pages: an Overview of revenue and profit, down into Supply Chain (Pareto of late orders by state, delivery performance by ship mode), Product (margin and return rate by sub-category), Customers (segments and high-value accounts) and Performance (KPIs by sales representative).

All metrics are built in DAX, including MoM/YoY comparisons, Perfect Order Rate, On-Time Rate and Profit Impact of Late Delivery. Pages are connected through drill-through and tooltip pages.

  • Power BI Desktop
  • DAX
  • Power Query
  • Star Schema
  • Time Intelligence
  • Pareto Analysis
  • Drill-through
  • Data Storytelling
  • DatasetRetail orders, 2014 – 2017
  • Orders9,994
  • Customers793
  • Report pages7 + 4 tooltip / drill-through
  • ScopeSales · Supply Chain · Product · Customer
  • ToolPower BI Desktop
Revenue
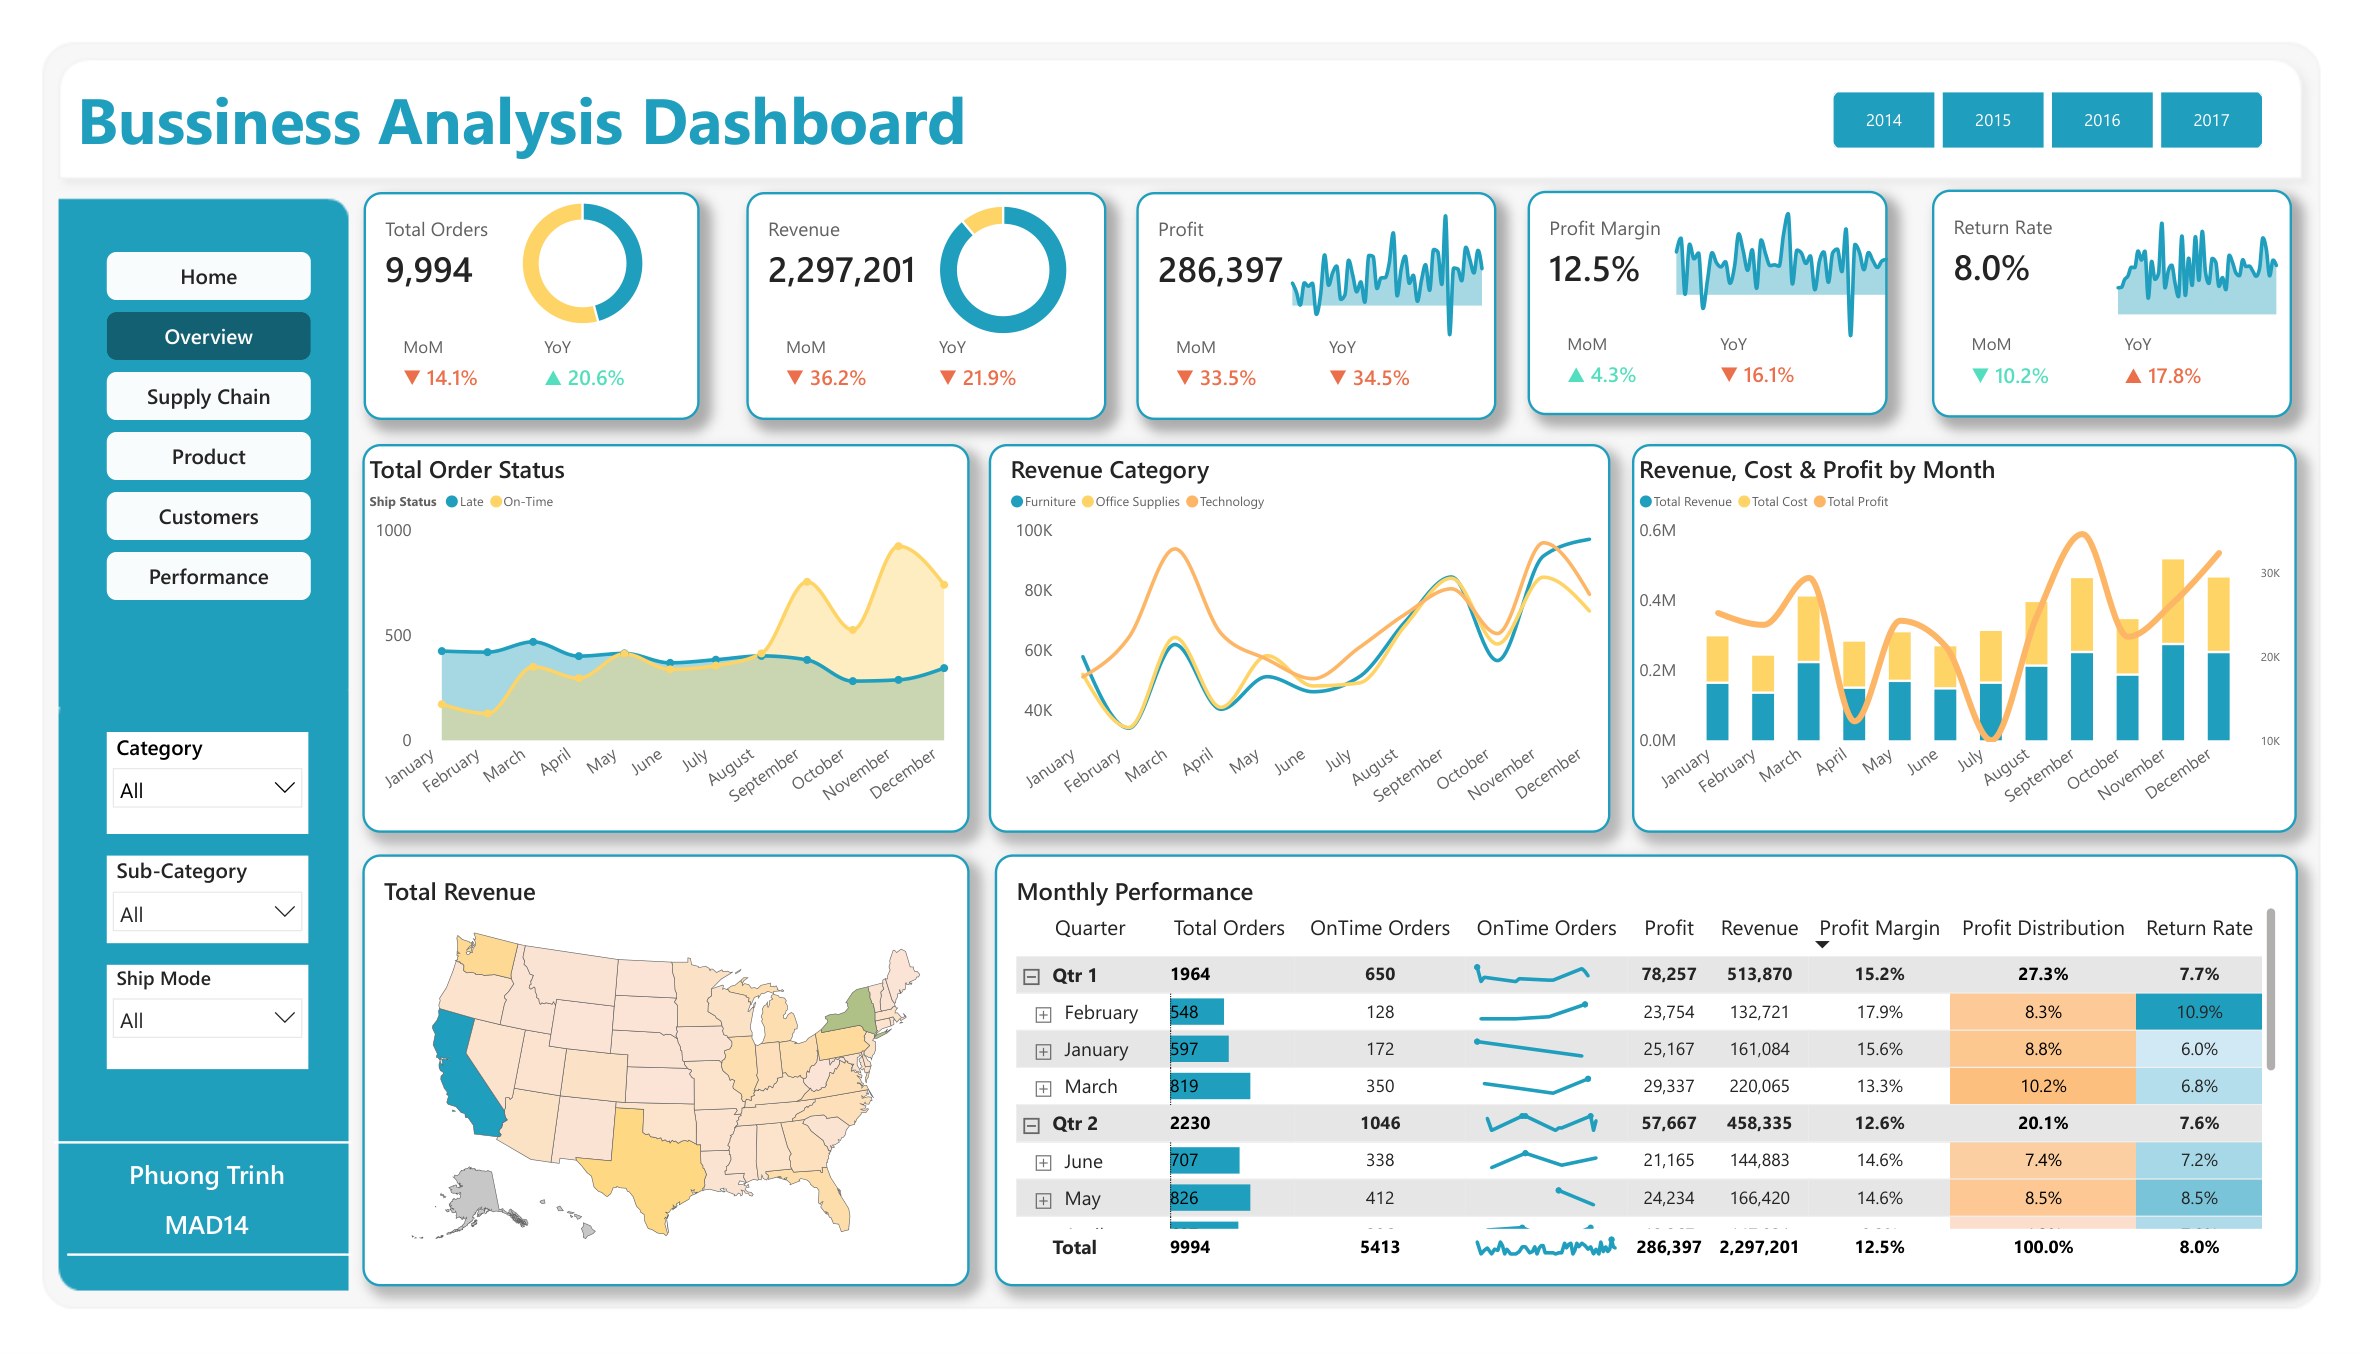
2,297,201
YoY ▼ 21.9%
Profit
286,397
Profit margin 12.5%
Return rate
8.0%
YoY ▲ 17.8%
On-time rate
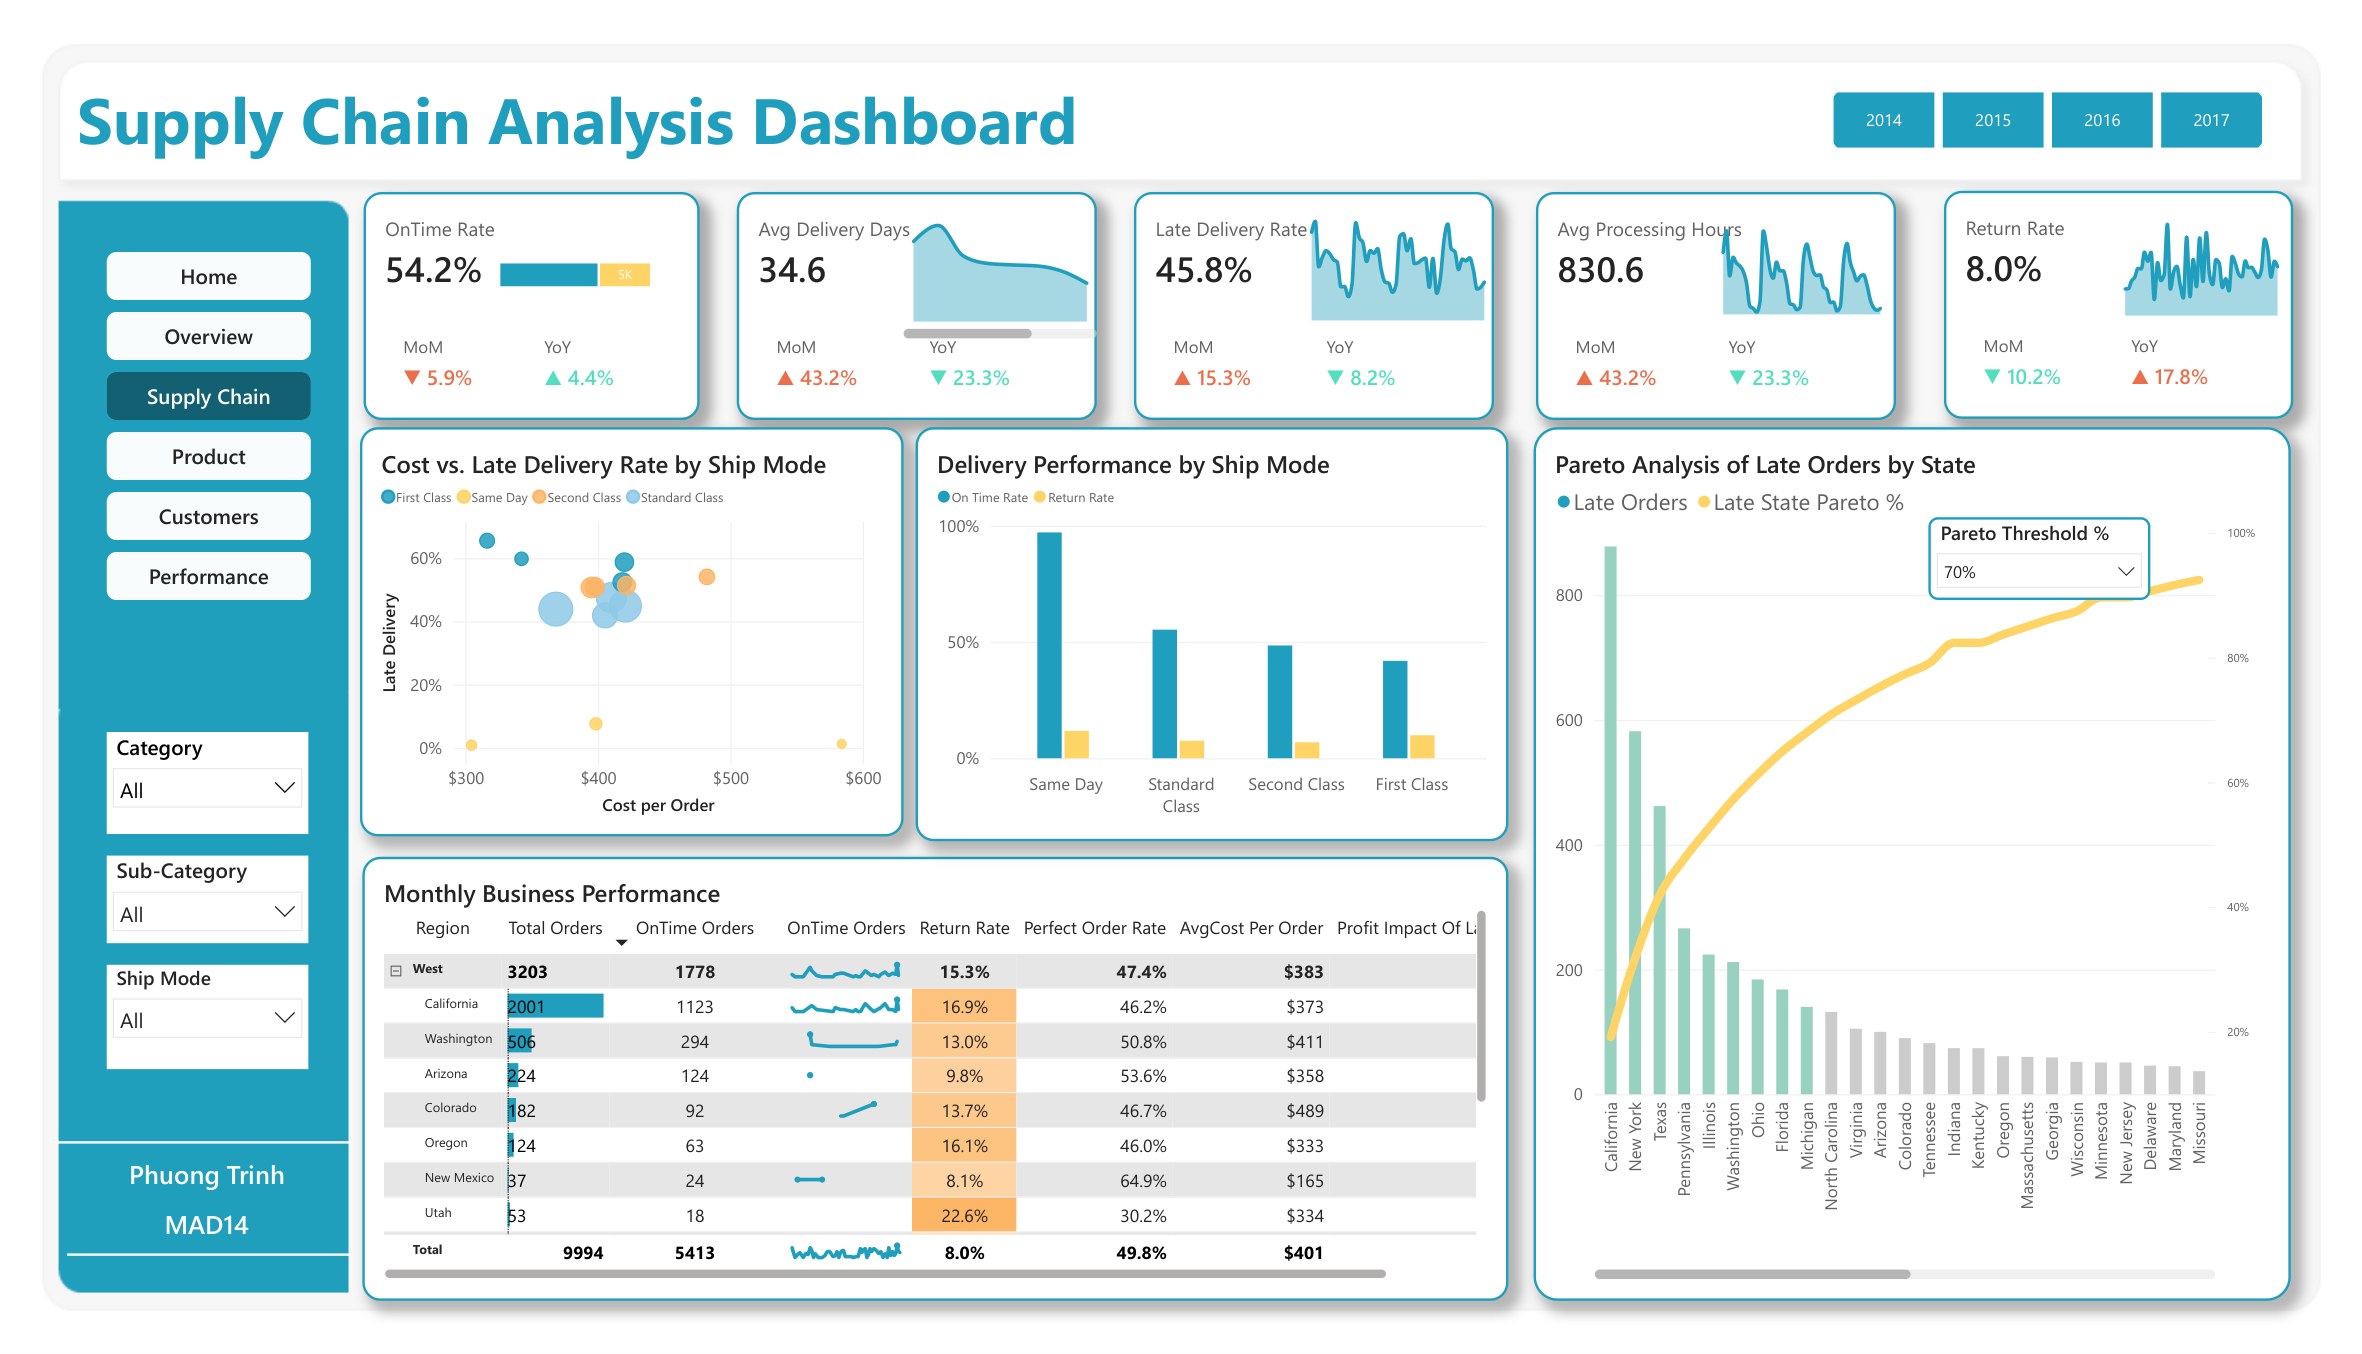
54.2%
Late delivery 45.8%
Avg delivery days
34.6
Avg processing 830.6 hrs
Performance score
72.4%
Revenue achievement 78.1%
Gallery

Report pages

Click any image to view it full size.

Dashboard home page

Home — Power your decisions with data

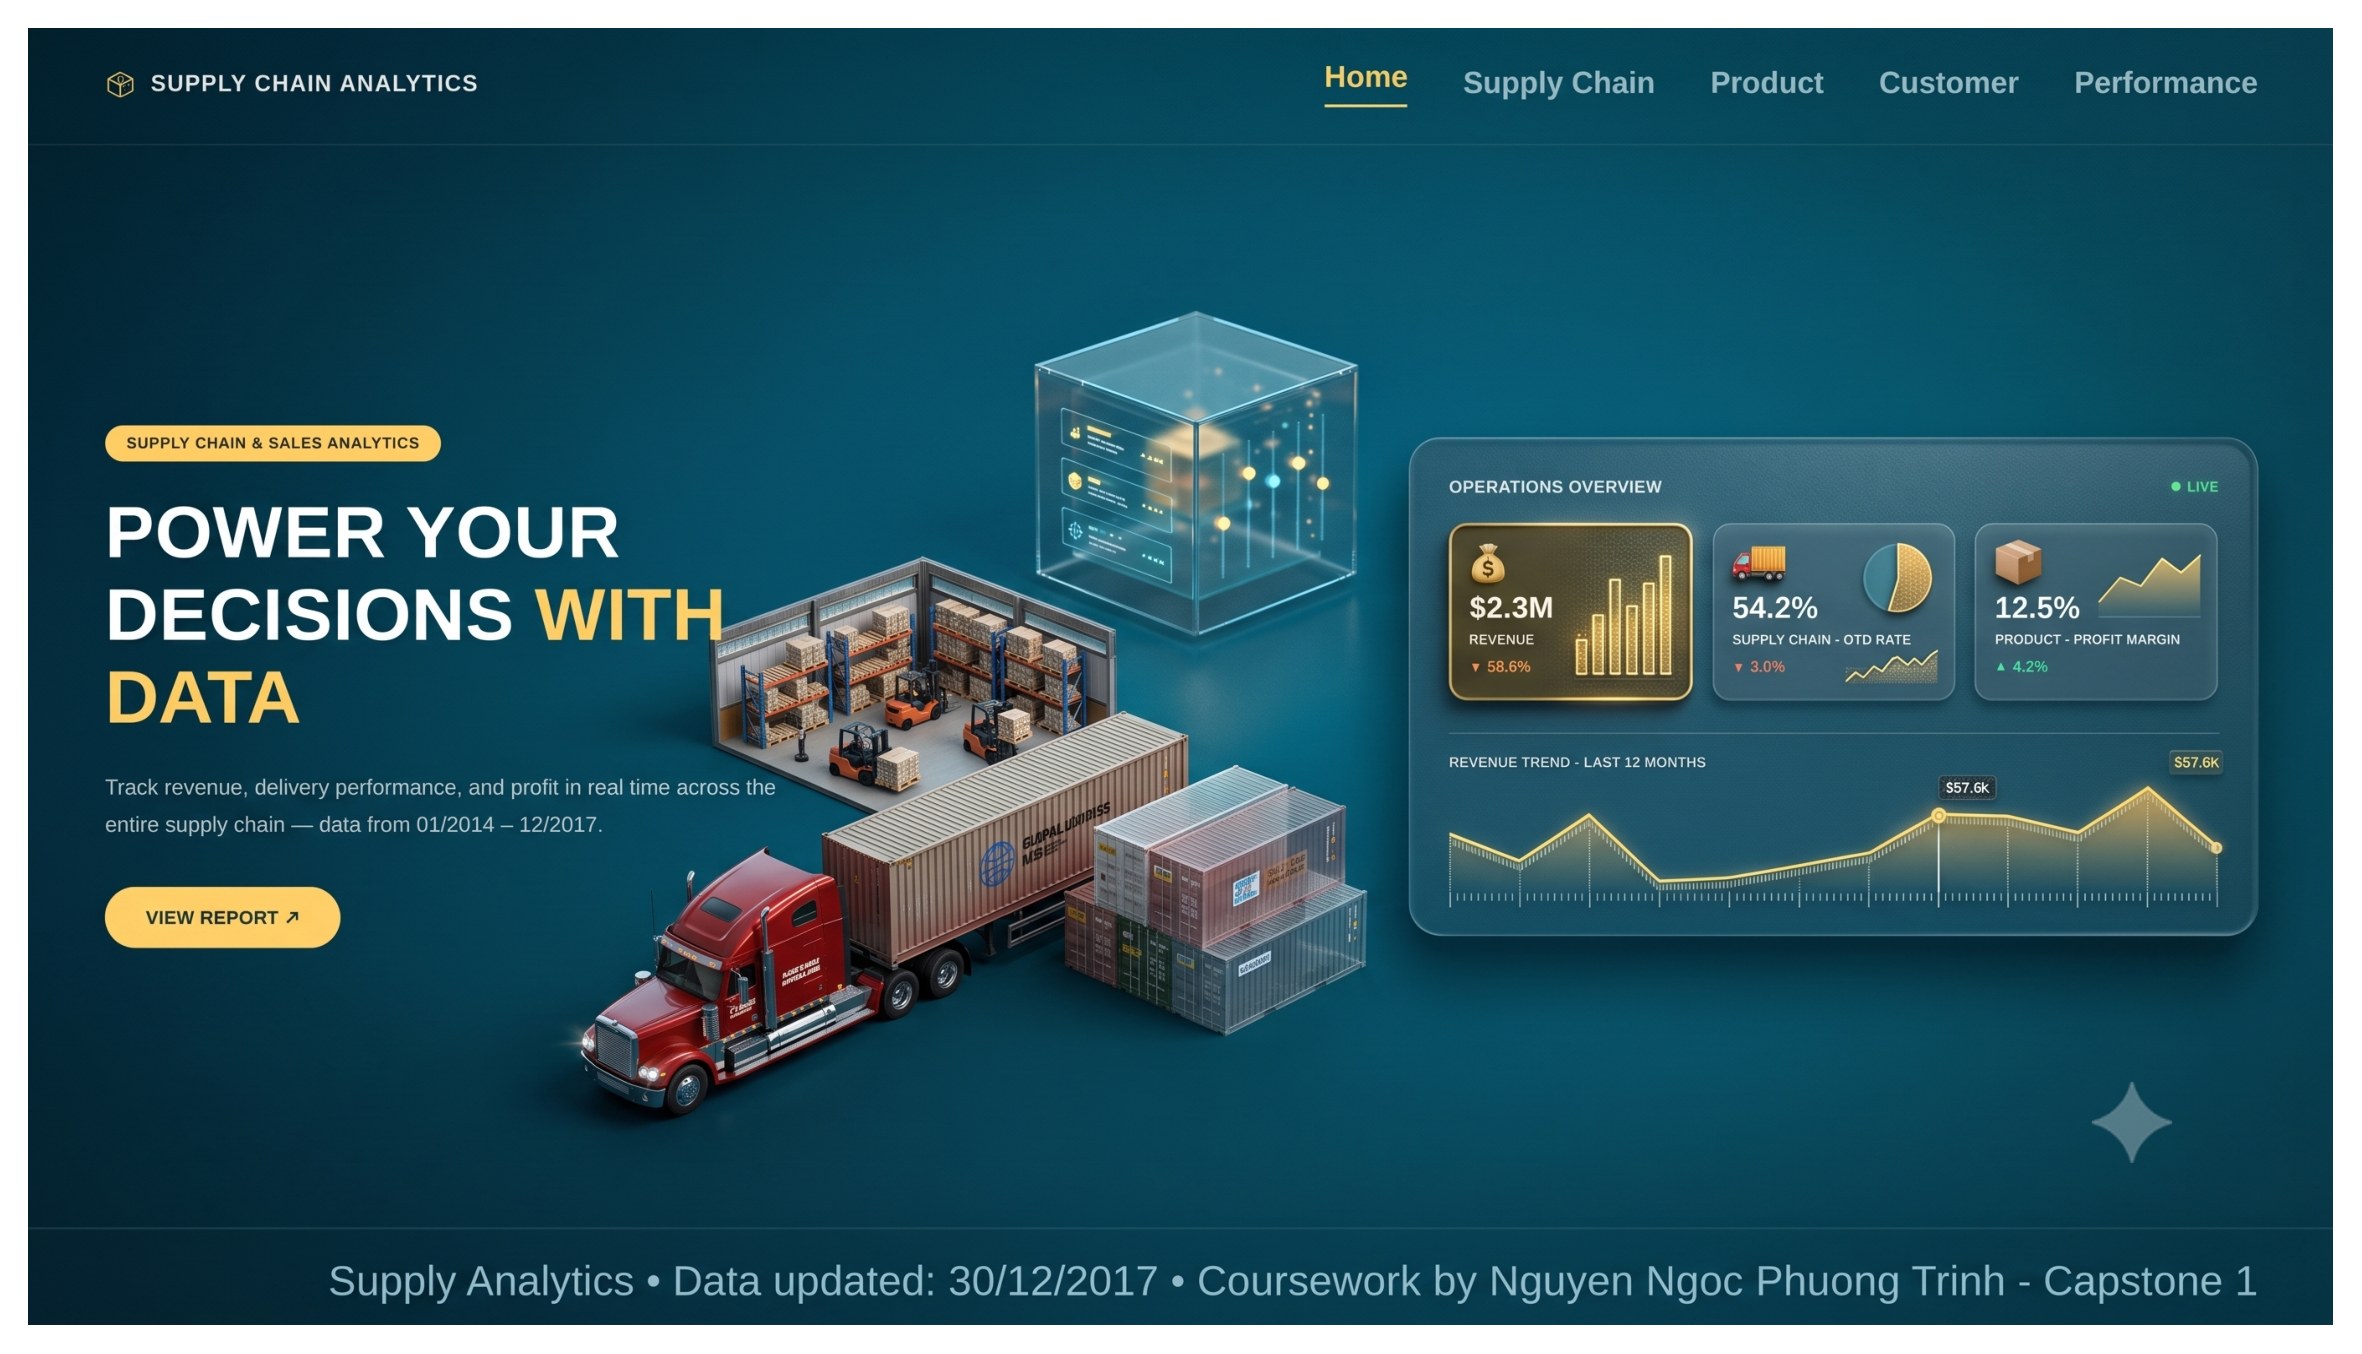
Landing page with three headline KPIs — revenue, on-time delivery rate and profit margin — over a twelve-month revenue trend.

Business analysis dashboard

Business Overview

Orders, revenue, return rate and profit margin with MoM/YoY deltas; monthly revenue–cost–profit and a quarterly performance table.

Supply chain analysis dashboard

Supply Chain

Pareto of late orders by state at a 70% threshold, with a regional table of on-time orders, return rate, perfect order rate and cost per order.

Delivery performance by ship mode

Delivery Performance

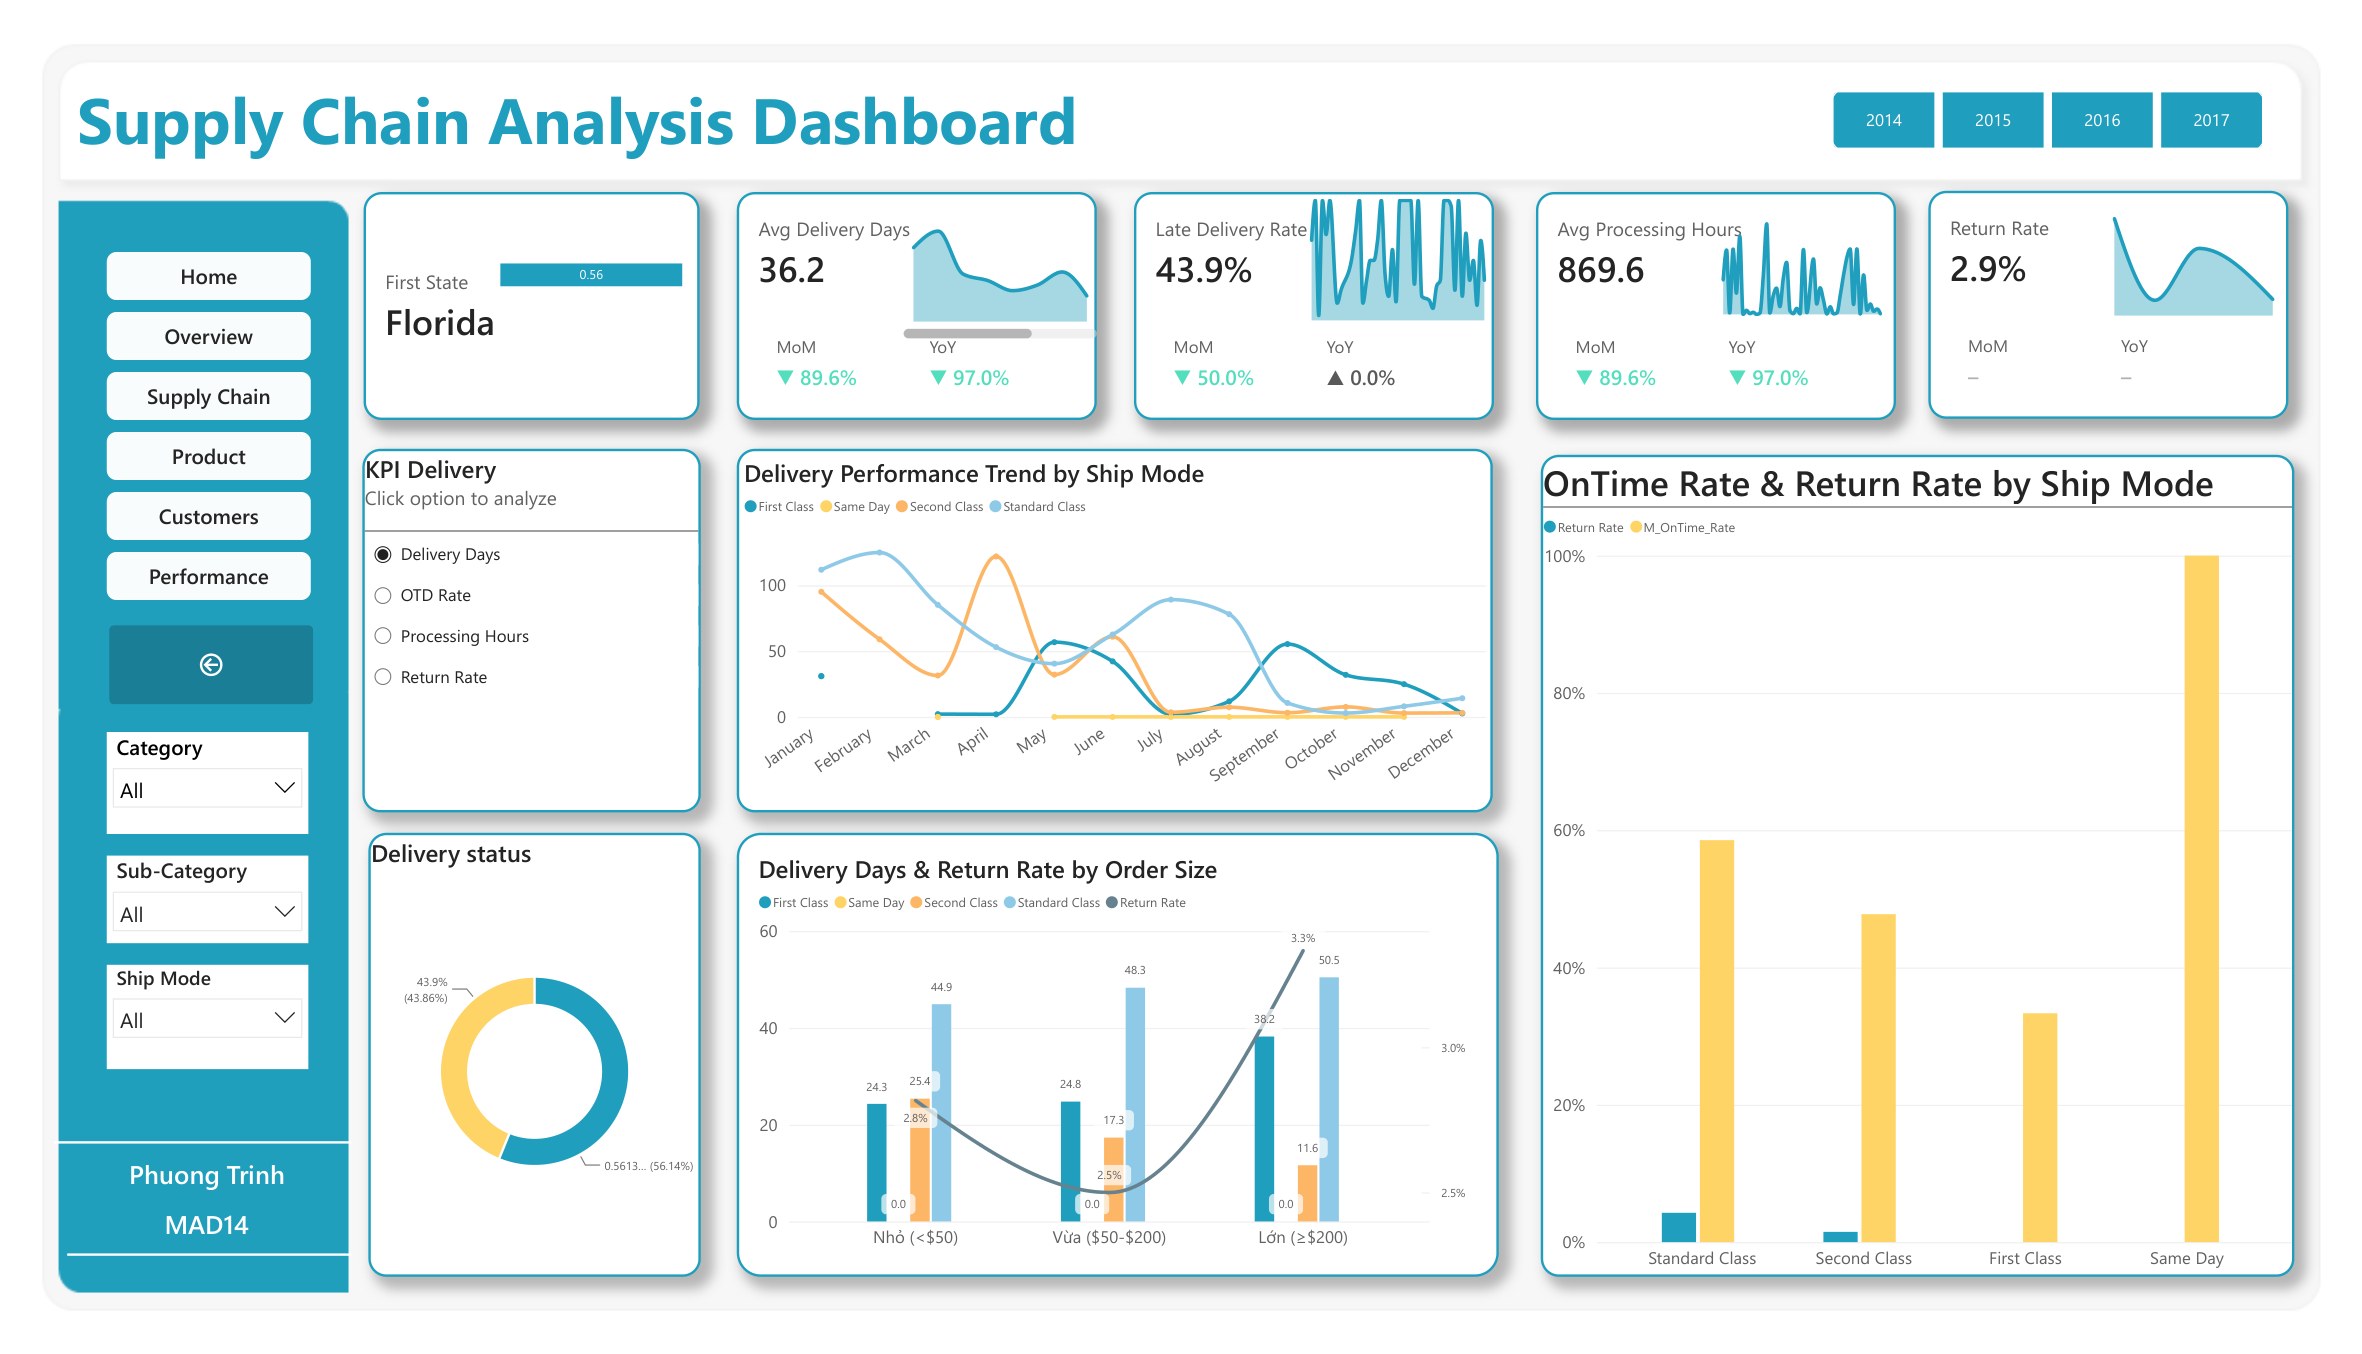
Delivery trend by ship mode, and delivery days against return rate across small, medium and large order sizes.

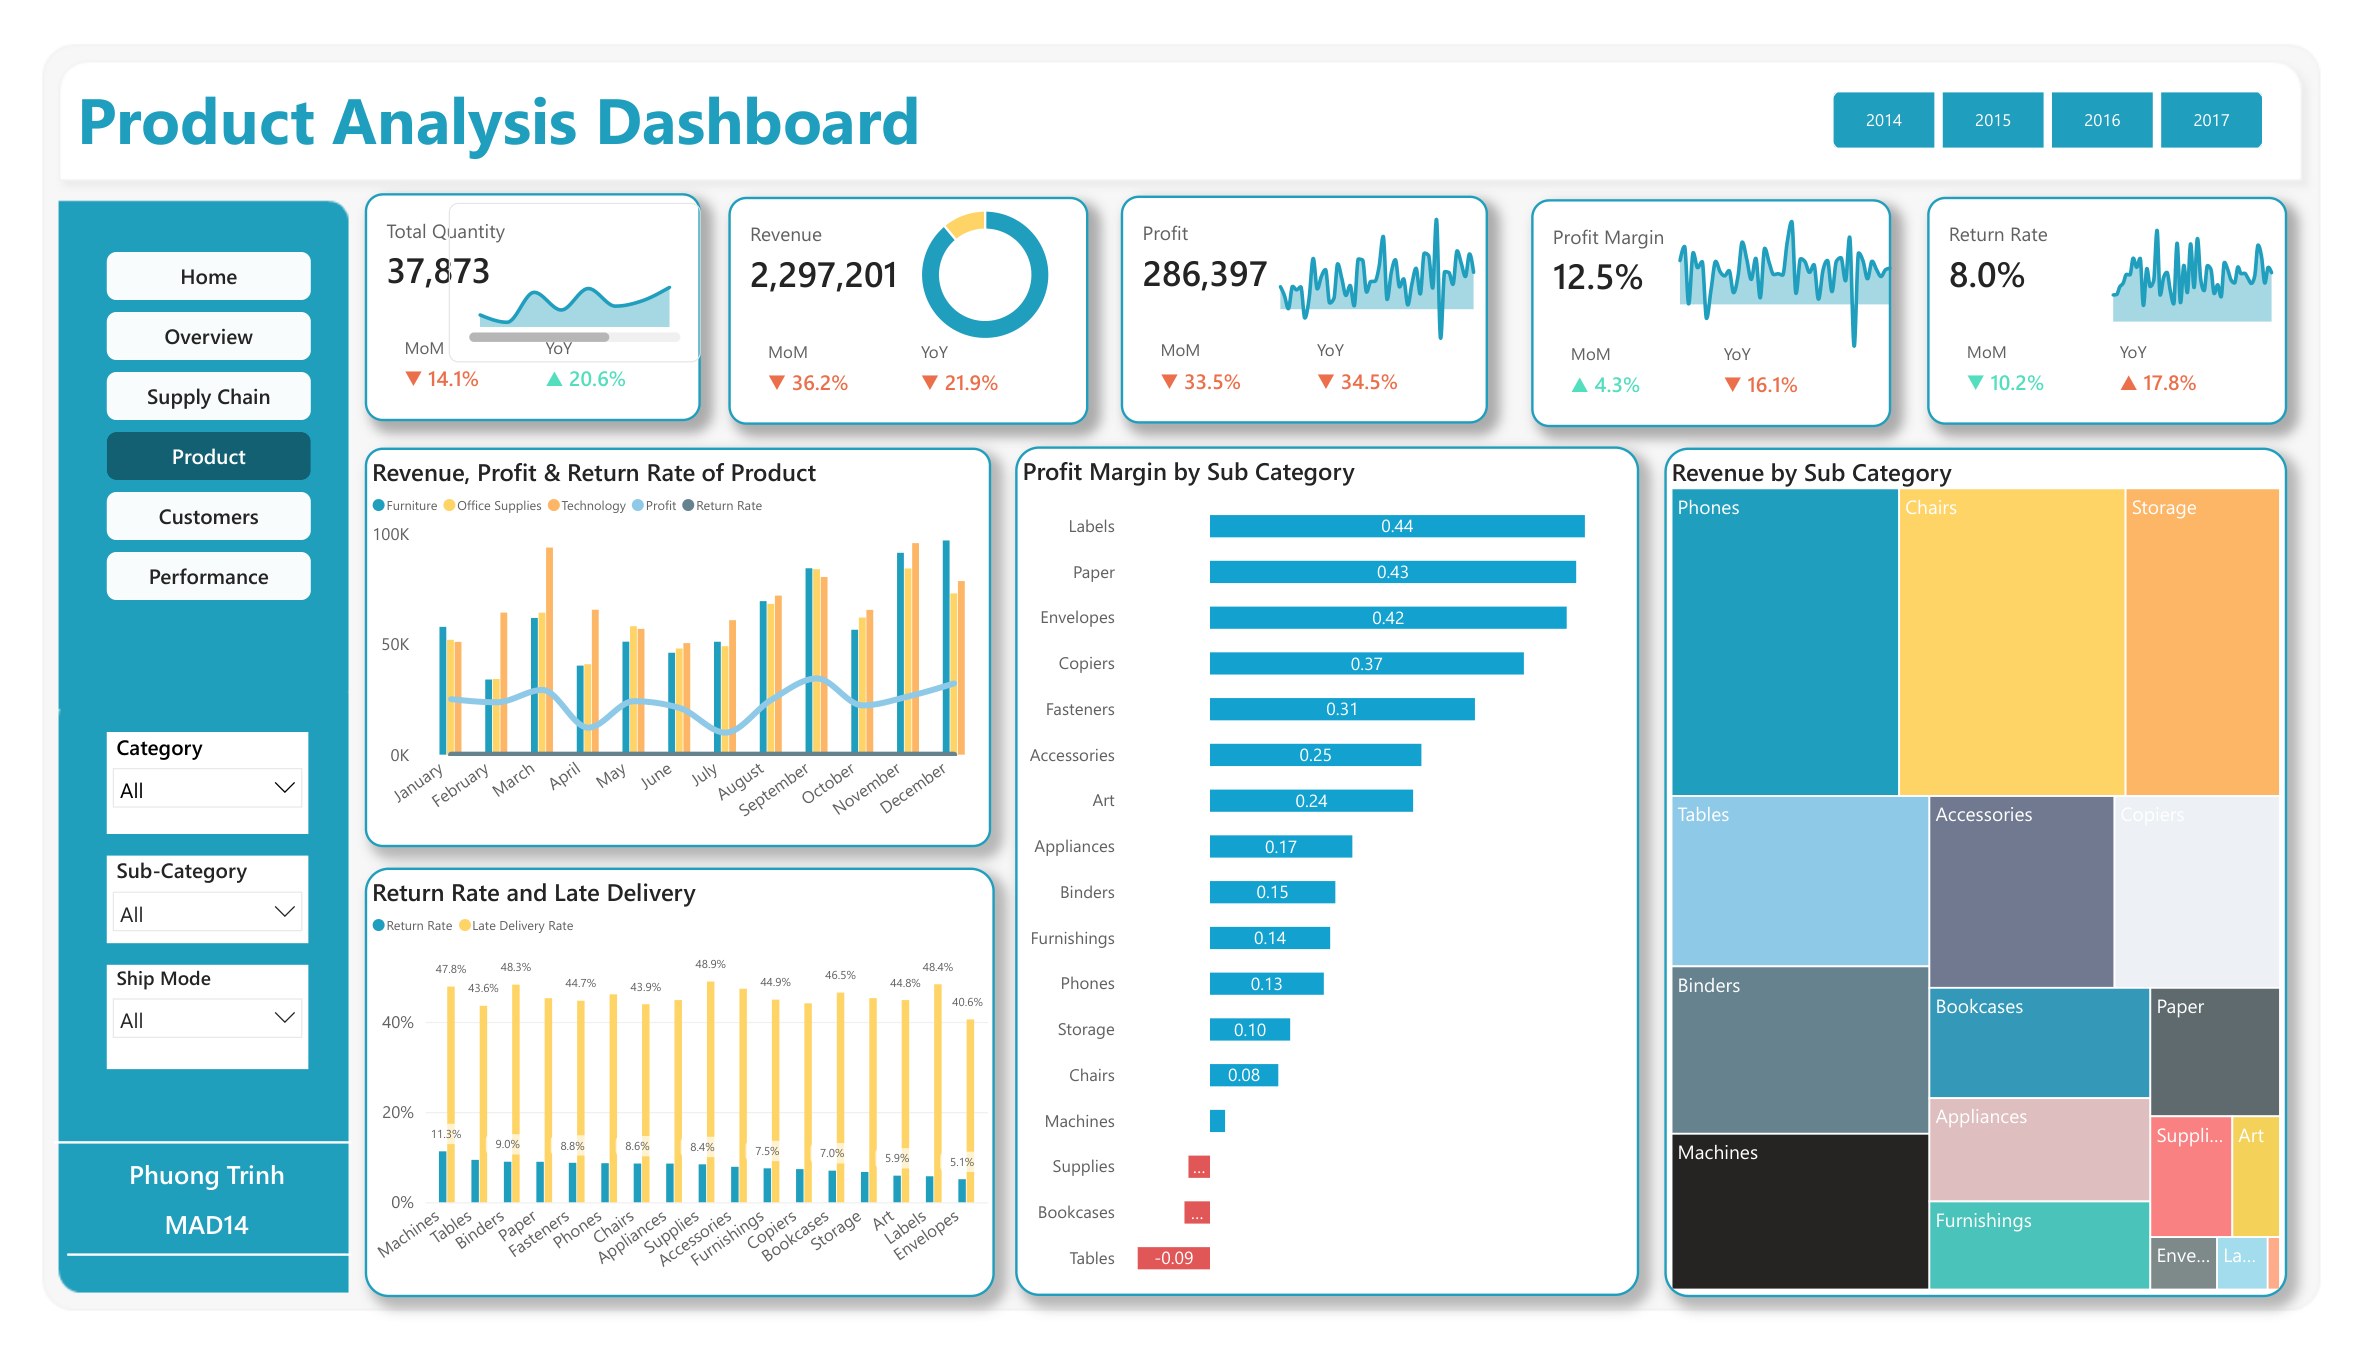
Product analysis dashboard

Product

Revenue and profit margin by sub-category, with return rate ranked directly against the late delivery rate of the same categories.

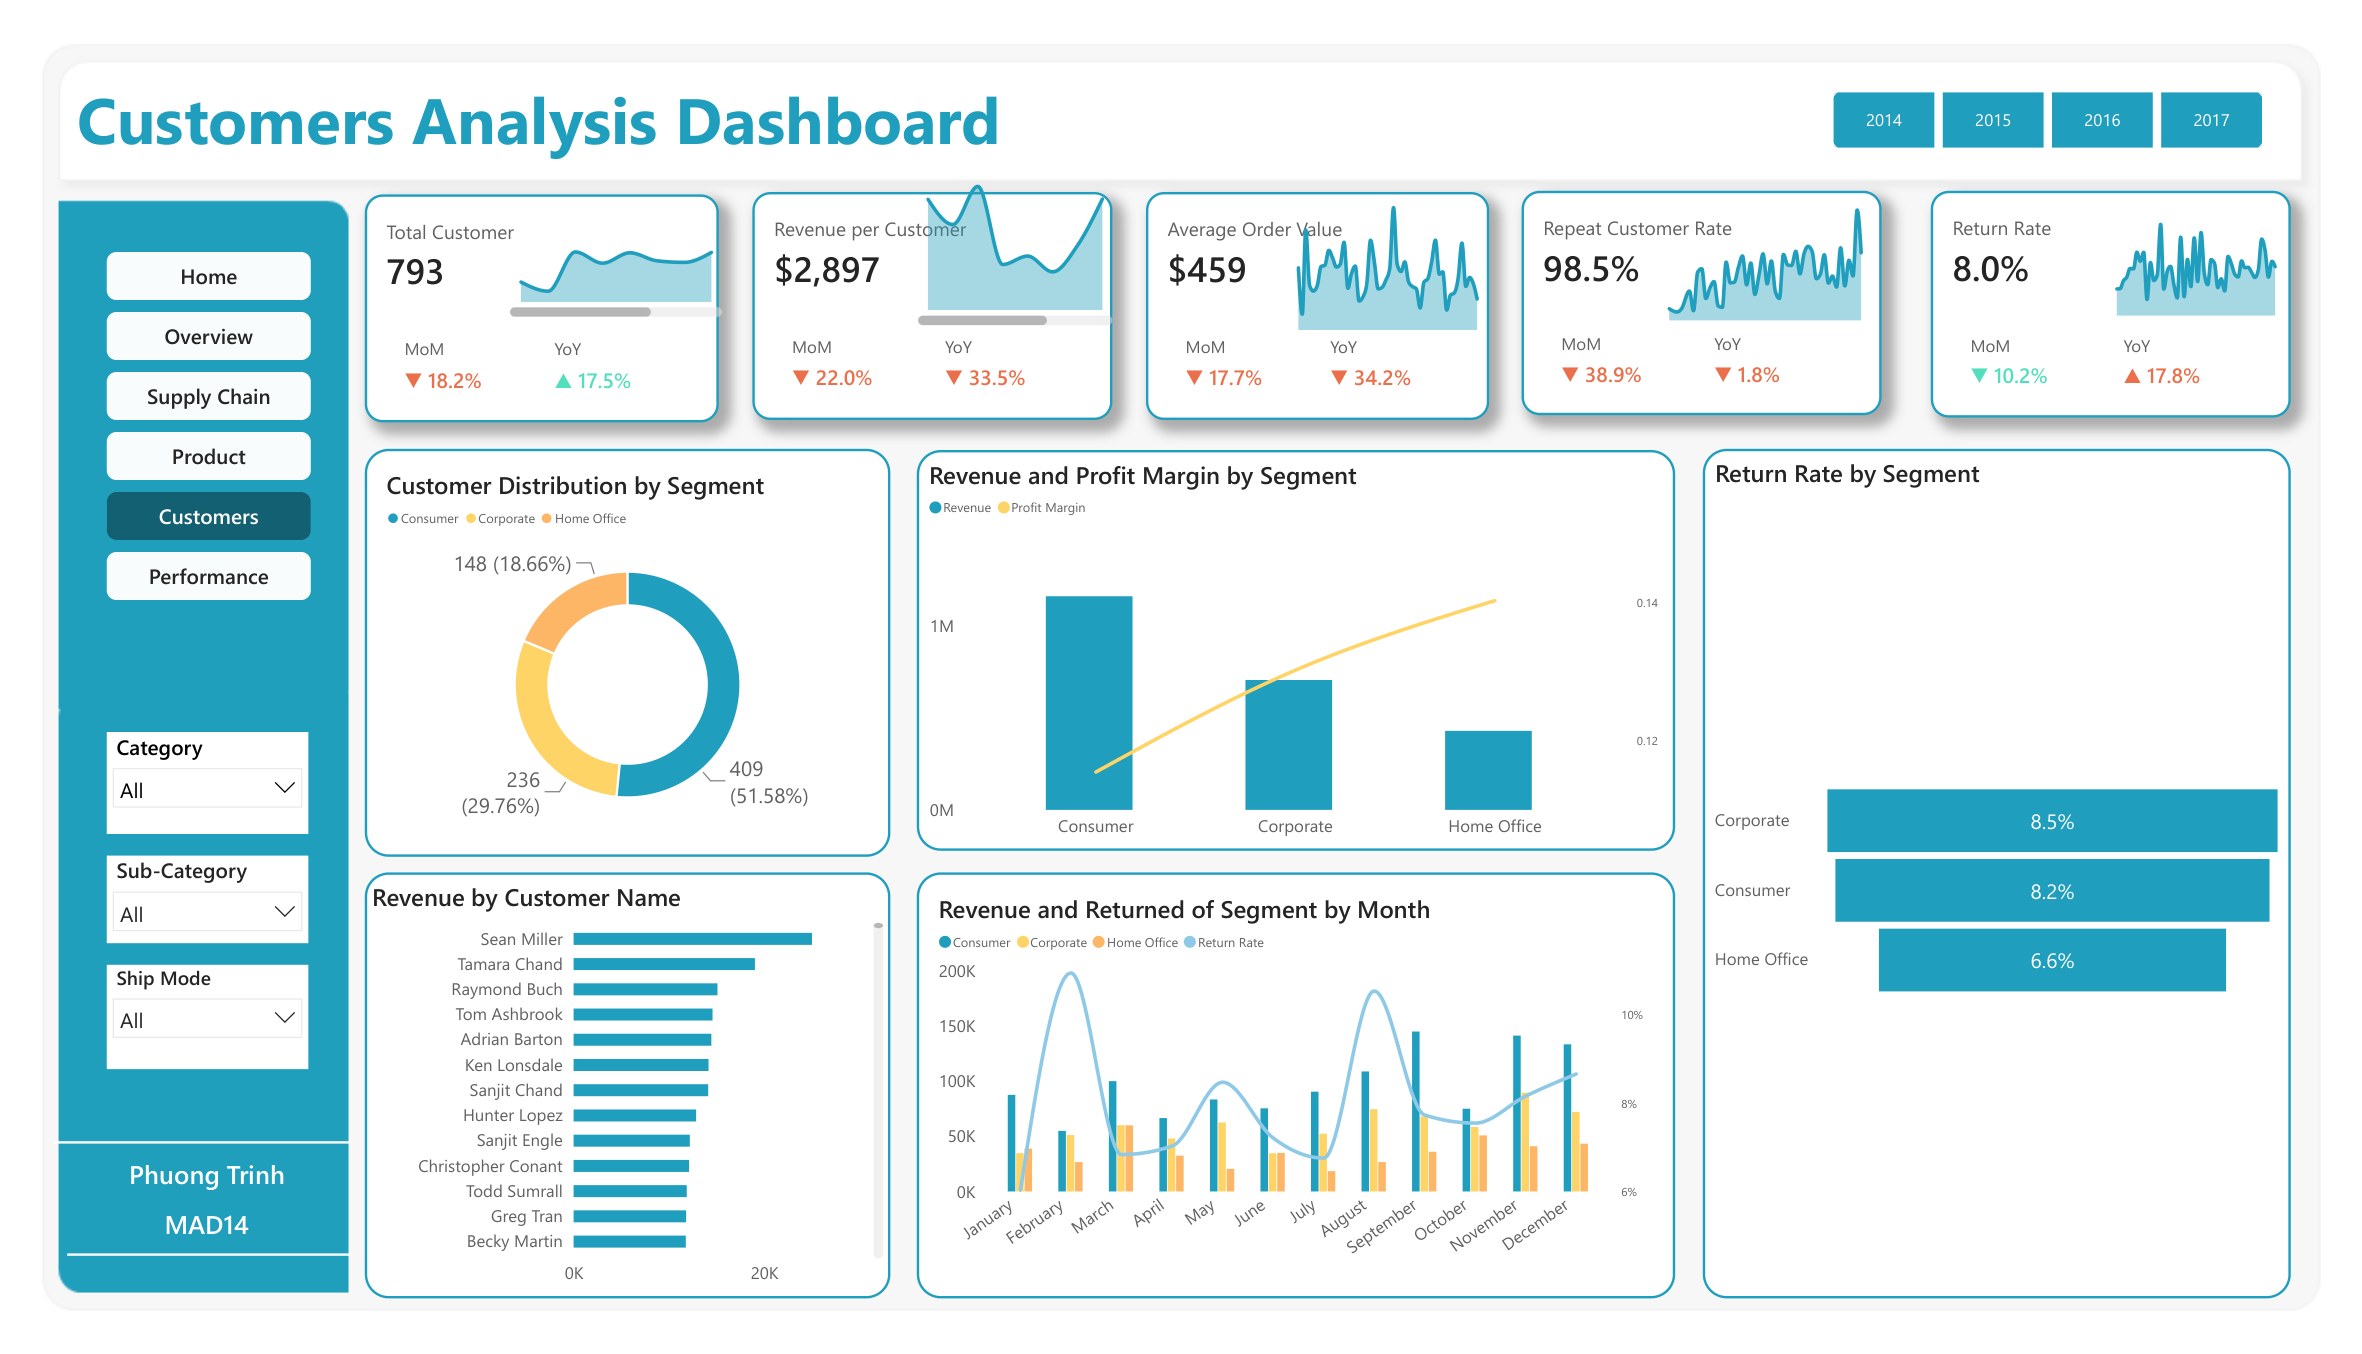
Customers analysis dashboard

Customers

793 customers across three segments: revenue per customer, average order value, repeat rate and return rate by segment.

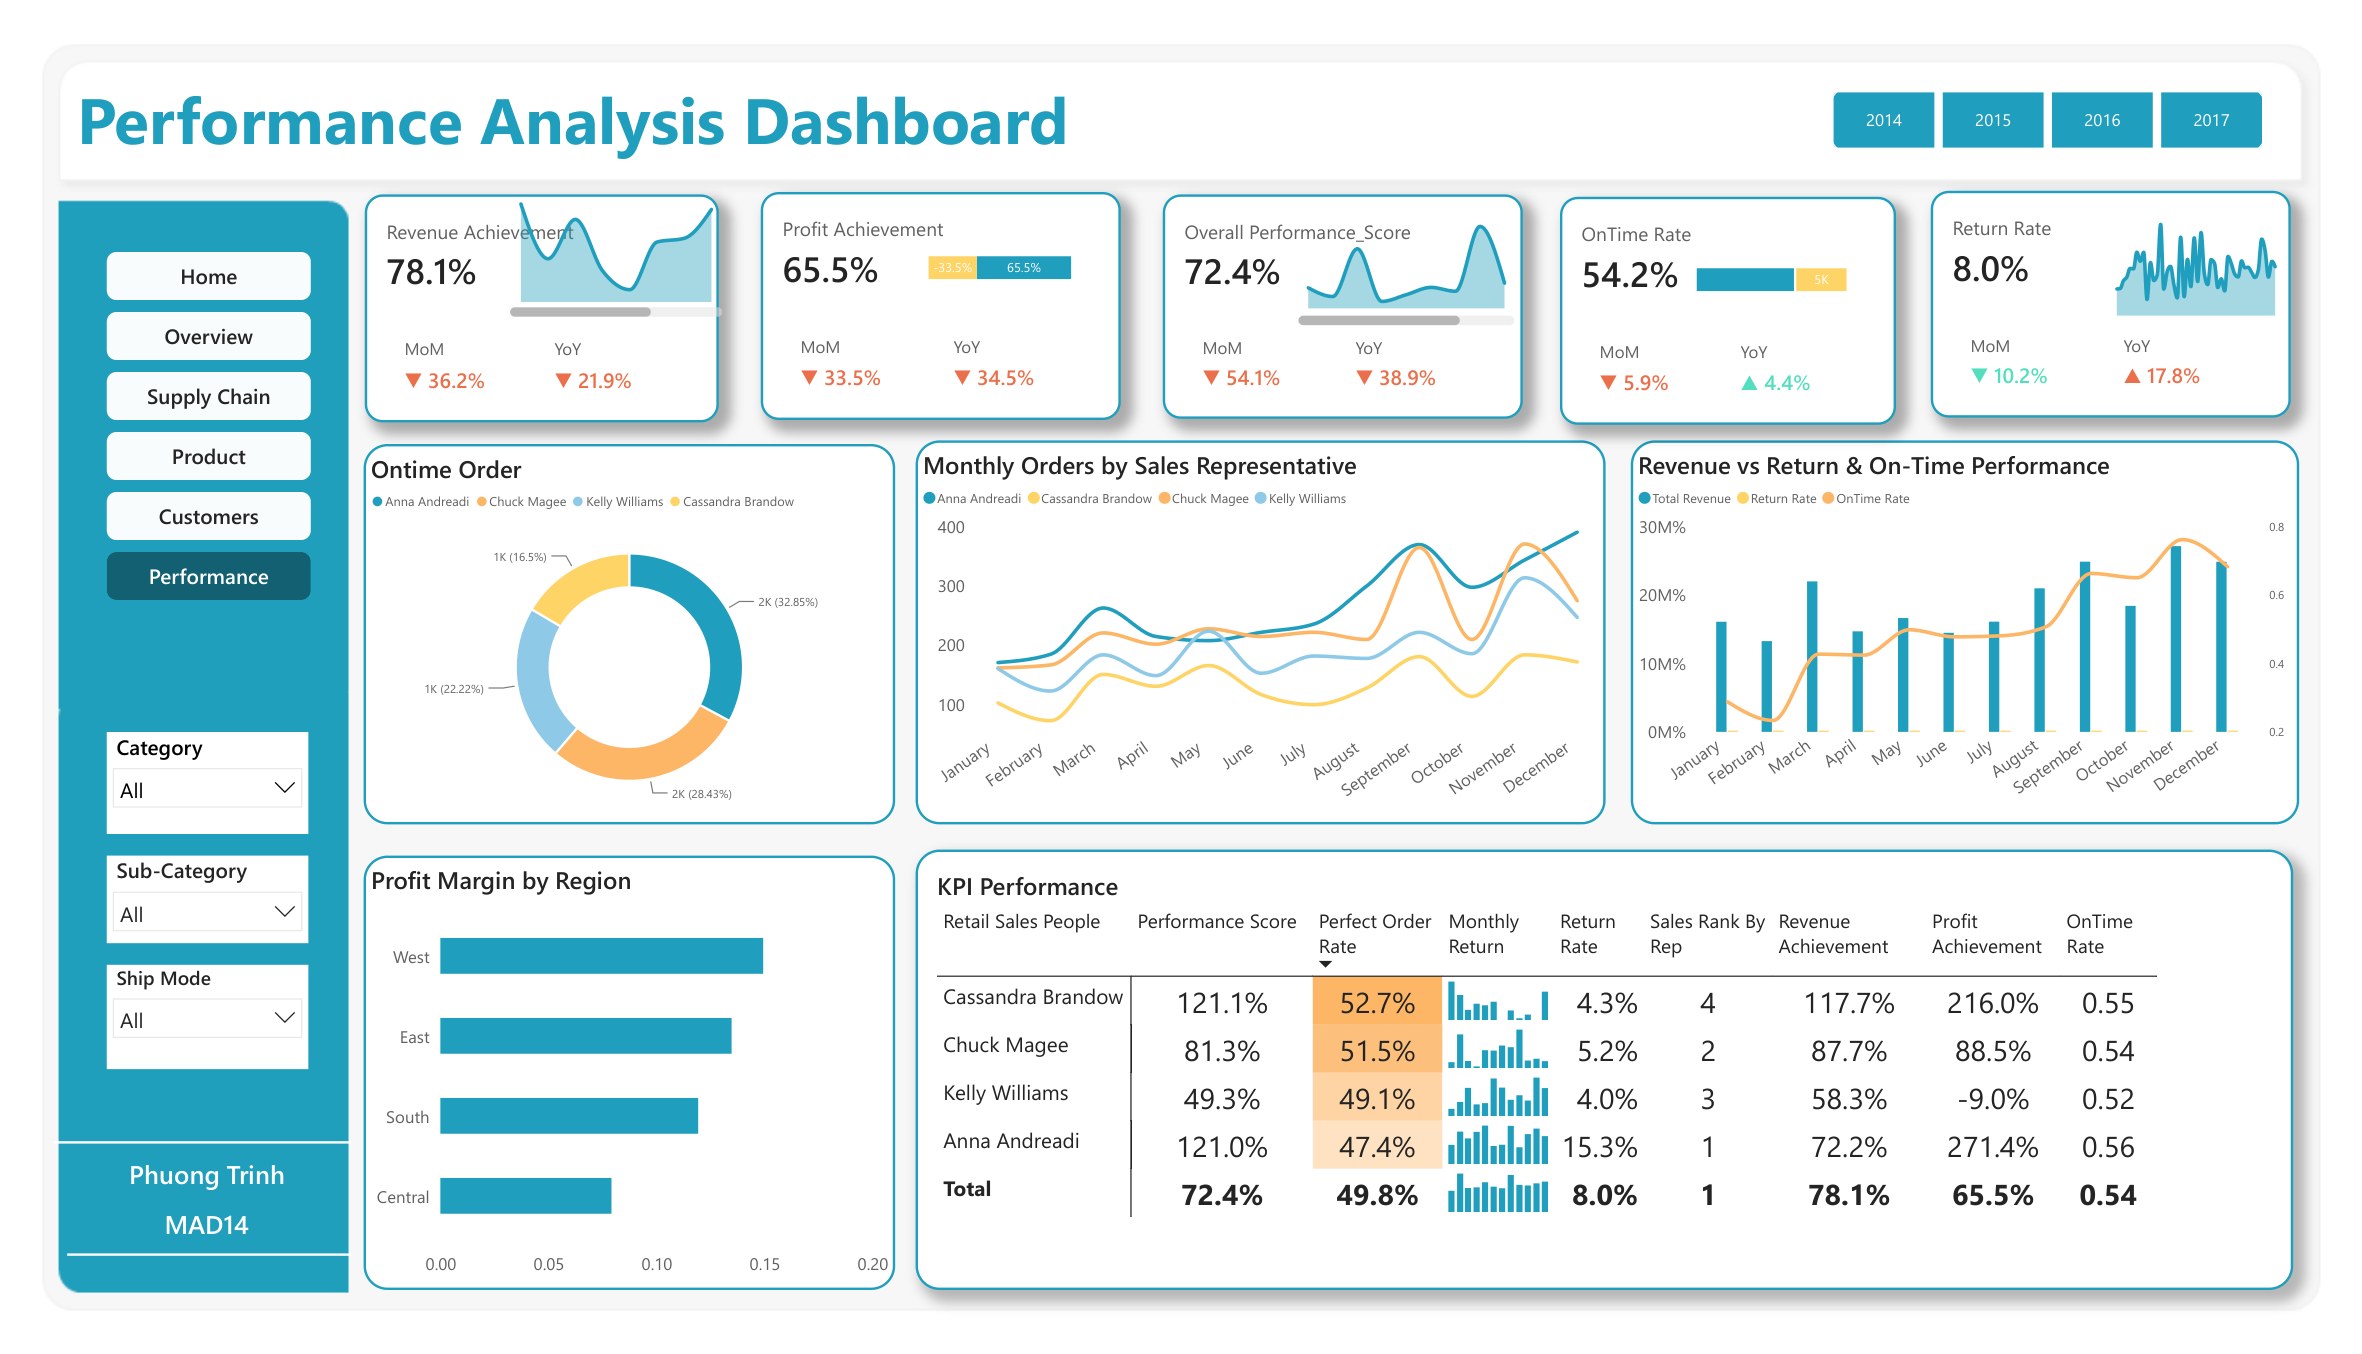
Performance analysis dashboard

Performance

Scorecard by sales representative: revenue and profit achievement, perfect order rate, on-time rate and revenue ranking.

Drill-through & tooltip pages

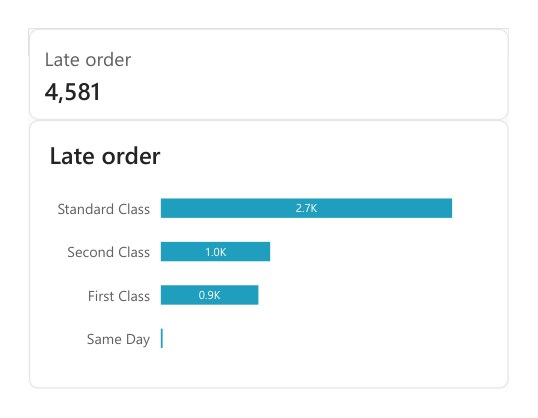
Late orders by ship mode

Late orders · Ship mode

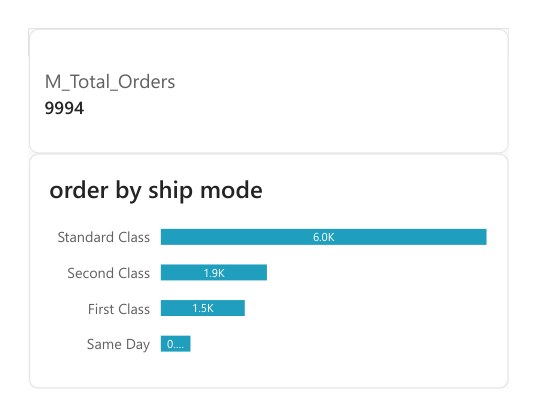
Orders by ship mode

Orders · Ship mode

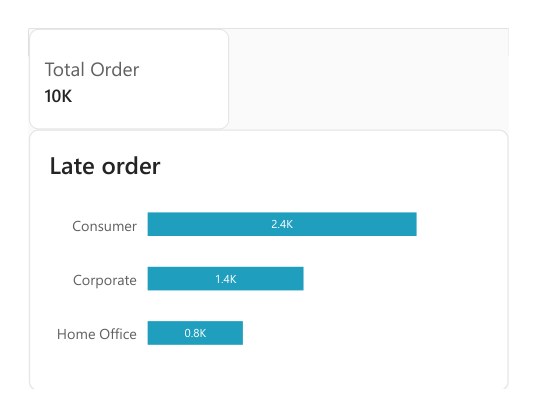
Late orders by segment

Late orders · Segment

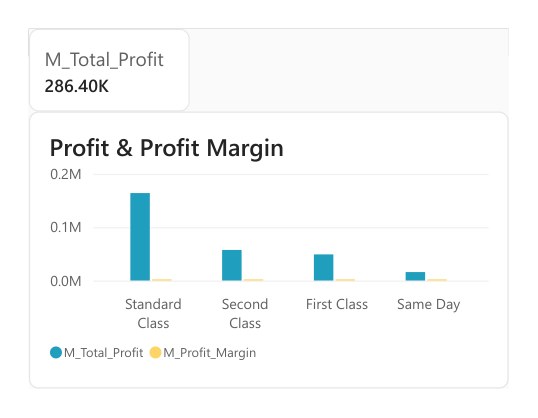
Profit by ship mode

Profit · Ship mode

What the data says

From numbers to decisions

Each conclusion below follows the same chain: evidence → finding → insight → recommendation. All figures come straight from the Power BI report.

Late delivery is systemic, not incidental

Evidence
Late delivery rate 45.8% · on-time rate 54.2% · average delivery 34.6 days · average processing 830.6 hours.
Finding
Almost half of all orders arrive late, and the processing stage before shipping accounts for most of the total lead time. The delay starts inside the operation, not in transit.
Insight
At this rate, lateness is a property of the current process rather than an exception. Tuning individual ship modes will not move the on-time rate far.
Recommendation
Set an SLA on the processing stage first, track perfect order rate weekly, and only optimise ship mode once processing lead time is stable.

Late orders concentrate in a handful of states

Evidence
Pareto of late orders at a 70% threshold: California (2,001 orders, 1,123 on time), New York, Texas, Pennsylvania and Illinois lead. The West region alone carries 3,203 orders at a 47.4% perfect order rate.
Finding
A small group of states produces most of the late orders, while the long tail contributes little.
Insight
The delivery problem is geographic. Spreading remediation evenly across the country dilutes it where it would not change the outcome.
Recommendation
Audit warehouse capacity and carrier performance in the states covering 70% of late orders before extending the effort anywhere else.

The most returned categories are also the latest delivered

Evidence
Return rate by sub-category: Machines 11.3%, Tables 9.0%, Binders 8.8%, Paper 8.6% — against late delivery rates of 43–49% in the same categories. Tables carries a negative margin (−0.09); Bookcases and Supplies sit near zero.
Finding
The sub-categories with the highest return rates are also among the latest delivered, and several of them are already losing money at the margin.
Insight
This is a behavioural correlation, not a definitional one: late delivery raises the chance of a return, and returns eat straight into margins that are already thin.
Recommendation
Address Tables and Machines first — either tighten the delivery SLA for these categories or reprice them to absorb the cost of returns.

Revenue is falling while the customer base stays

Evidence
Revenue 2,297,201 (YoY ▼ 21.9%) · revenue per customer $2,897 (YoY ▼ 33.5%) · AOV $459 · repeat customer rate 98.5%. Consumer is 51.58% of customers, but Corporate carries the highest return rate at 8.5%.
Finding
Revenue per customer is falling faster than total revenue. Customers are not leaving; each one is simply spending less.
Insight
With a 98.5% repeat rate, the risk sits in the experience of existing customers rather than in a shortage of new ones. Poor delivery is eroding the value of each relationship.
Recommendation
Re-measure revenue per customer after the on-time rate improves, rather than spending the budget on acquisition.
Data limitations and their direction: the dataset covers orders from 2014–2017 and contains no warehouse operating costs, returns handling costs or inventory carrying costs. Profit and margin figures above are therefore overstated. The data stops on 30 December 2017, so the final period's MoM movements are truncated and should be read as a signal, not a conclusion.
Credential

Certificate of Completion

Master Analytical Thinking & Data Analysis with Power BI — The Future Analyst Academy, issued 15 August 2026.

Certificate of Completion — Nguyen Ngoc Phuong Trinh

Click the image to view full size · ID MAD14Q7E3 · 08/15/2026

In progress

Next capstones — expected October 2026

Three programmes running in parallel, each ending with its own capstone and certificate in mid-October 2026. This section will be updated as results come in.

Expected Oct 2026

AI Agent for Data Analytics & Decision Making

Building an AI agent that runs the full analysis loop — raw file, cleaning, descriptive and diagnostic analysis, report — to shorten the distance between data and decision instead of rebuilding it by hand each period.

  • AI Agent
  • Workflow Automation
  • Decision Support
  • Prompt Design
Expected Oct 2026

AI-Powered Excel for Data Analytics

Bringing AI into Excel to cut down data preparation and reporting time — the closest fit to daily store operations, where most numbers still live in a spreadsheet.

  • Excel
  • AI Formulas
  • Data Prep
  • Reporting
Expected Oct 2026

AI-Powered Google Sheet for Data Analytics

Analysis in Google Sheets with AI assistance, aimed at reports that can be shared with decision makers immediately and stay current without anyone installing software.

  • Google Sheets
  • Apps Script
  • Collaboration
  • Live Reporting
Get in touch

Contact & project files